Application log data is a useful source of information that provides an insight on how the customer interacts with the product. It also helps in troubleshooting the issues with the application and getting to the root cause of the problem.
Most enterprises rely on APM (Application Performance Management) tools to monitor the system health ensuring application availability and performance levels are met. While APM tools come with out of the box features that helps in reporting important metrics like response times, service call volumes, errors etc. , they don’t offer any insight into the business errors or any other custom metrics in context of the business. This is where Log Analysis comes to the rescue, providing a better insight in the context of the business and answering the complex business questions.
There are many great tools in the market like Splunk that helps in aggregating the logs and data from multiple servers and applications. Once the data is collected and aggregated, it can be searched, correlated and visualized to find any operational issues impacting the business. While Splunk is by far the most widely used Log Management tool in most of the enterprises, there are many other good options available like Loggly, Logstash, ElasticSearch and Kibana. These tools require the logs to be formatted before they are ingested into the tool for further analysis. There are scenarios where either the application is not integrated with the central log management tool or the manual analysis of logs to visualize the data in the context of the business provides a quick and deeper insight into the application issues.
We’ll see few examples of how the log data can be analysed using a data visualization tool like Tableau to understand the application behavior and troubleshoot business errors.
Figure 1 shows the heat map for the number of times an error occurred every hour based on the logs data collected over several days.
This log data visualization reveals several interesting facts
- System Error is observed mostly during the busy hours of the day and not during the early morning hours.
- When the bug resulting in the System Error was fixed, no errors were observed in the month of November.
- On Oct 1 around 9:00 AM there are large number of timeout errors in the system that occurred within an hour. On further investigation (Figure 2), it turns out that all these errors occurred for only 5 mins and not the full hour as seen in figure 1. This suggests that something went wrong in the system resulting in large number of errors in a short time interval.
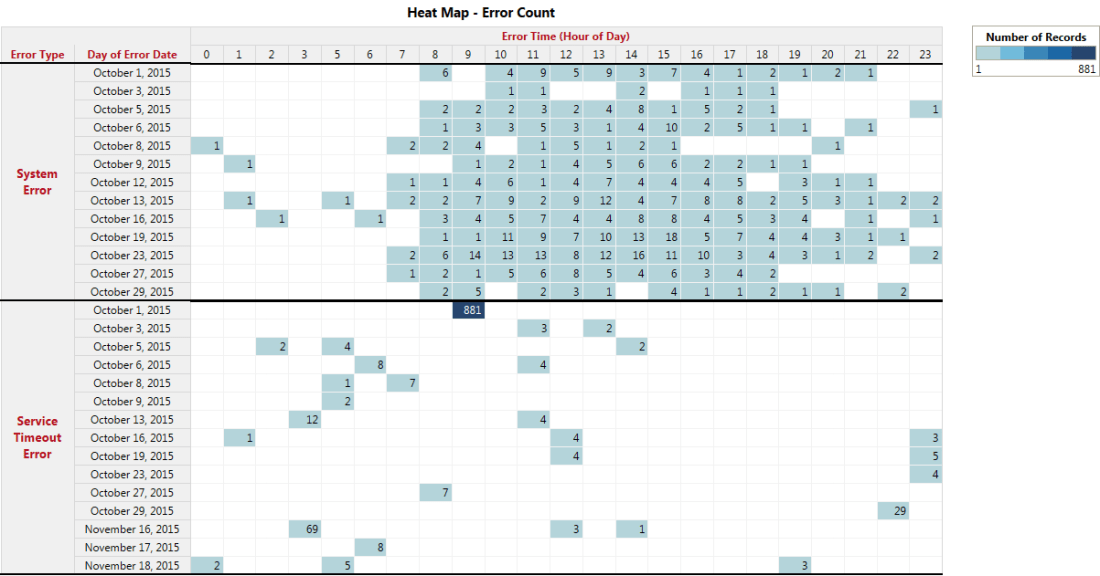
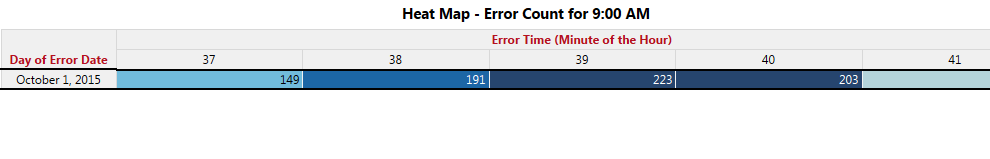
Figure 3 shows the response time for the service calls grouped in bins on the x-axis and the number of calls on the y-axis. This view helps in analyzing the service calls with response time falling outside the acceptable SLA.
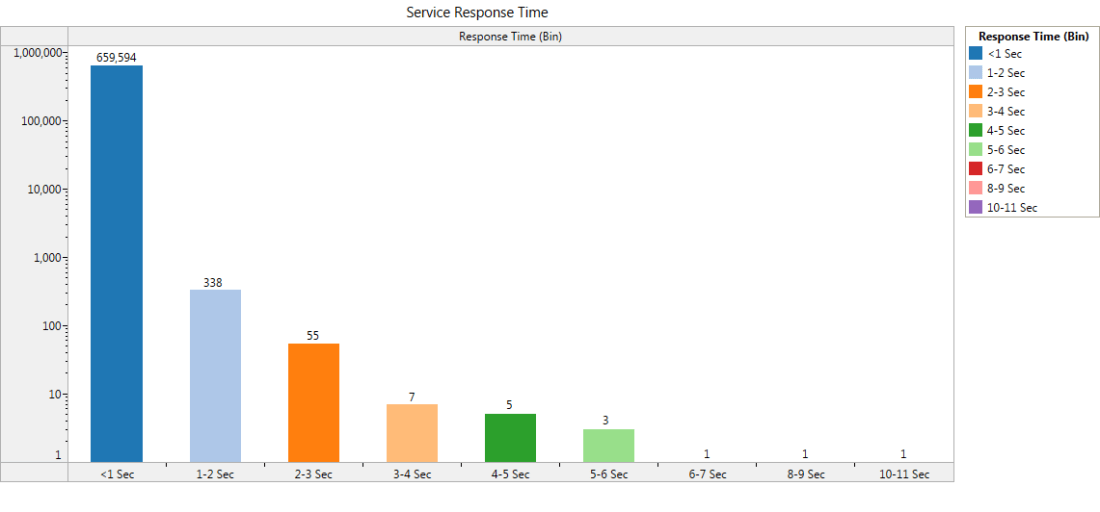
Figure 4 shows the visualization for the total number of service calls vs the errors seen in the logs over a period of time. This shows a correlation between the number of service calls and the total count for the errors on a specific day.
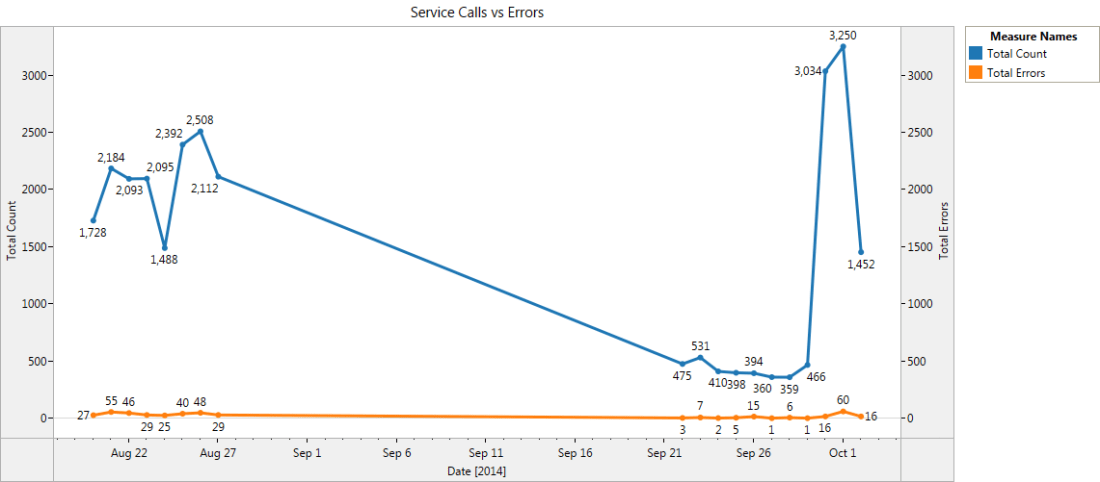
Figure 5 shows the number of service calls that timed out over a 24 hour period. The x-axis is the hour of the day and the y-axis is the minute of the hour. This visualization shows the system performance every minute of the hour spread throughout the day in a single view. The heat map helps in visualizing the error density and the correlation with the other errors.
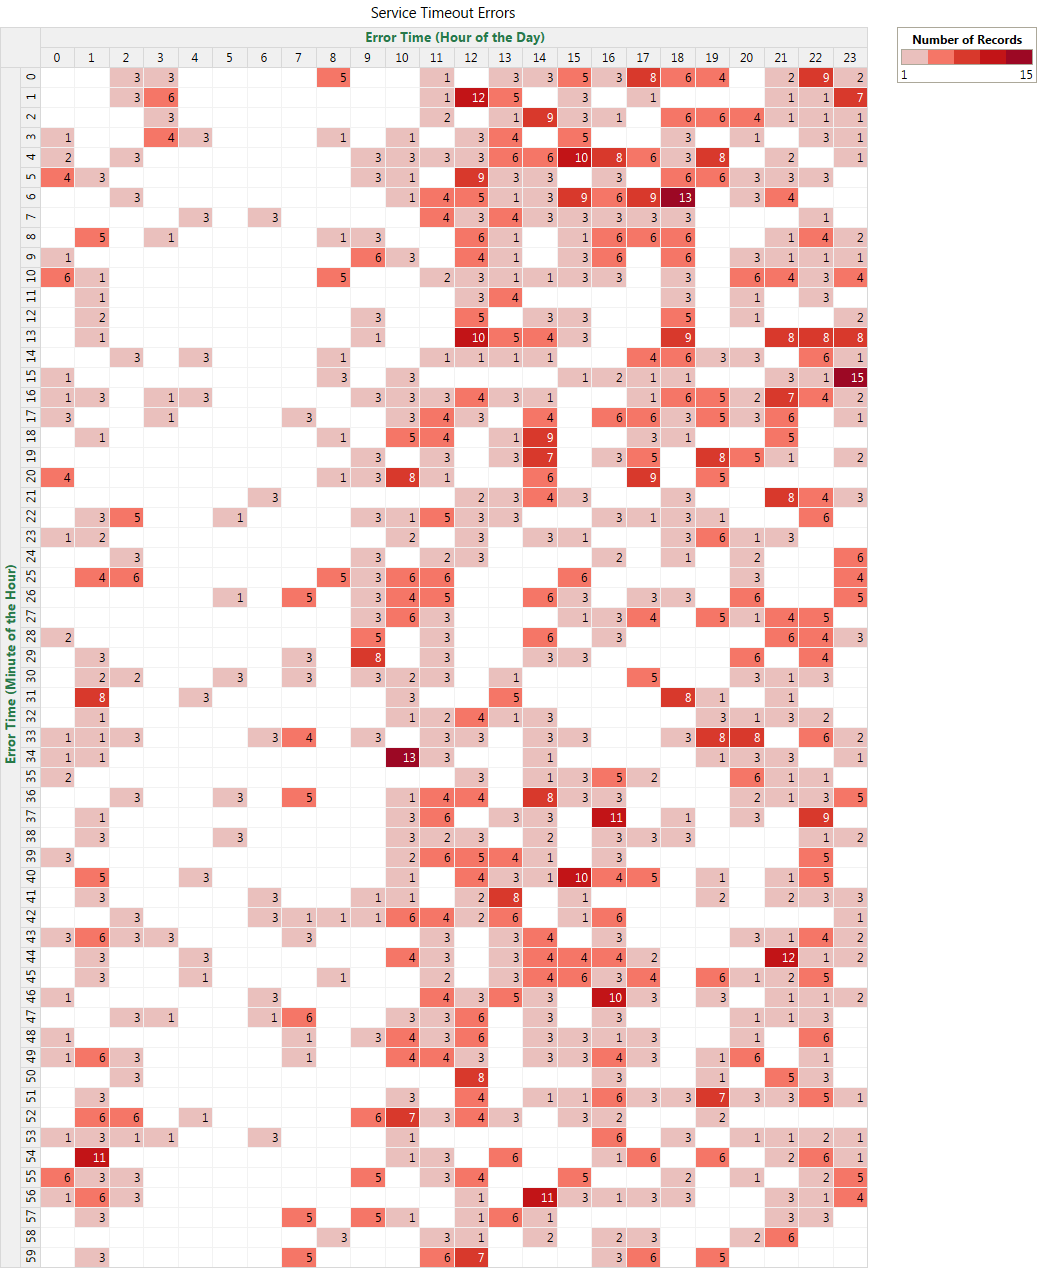
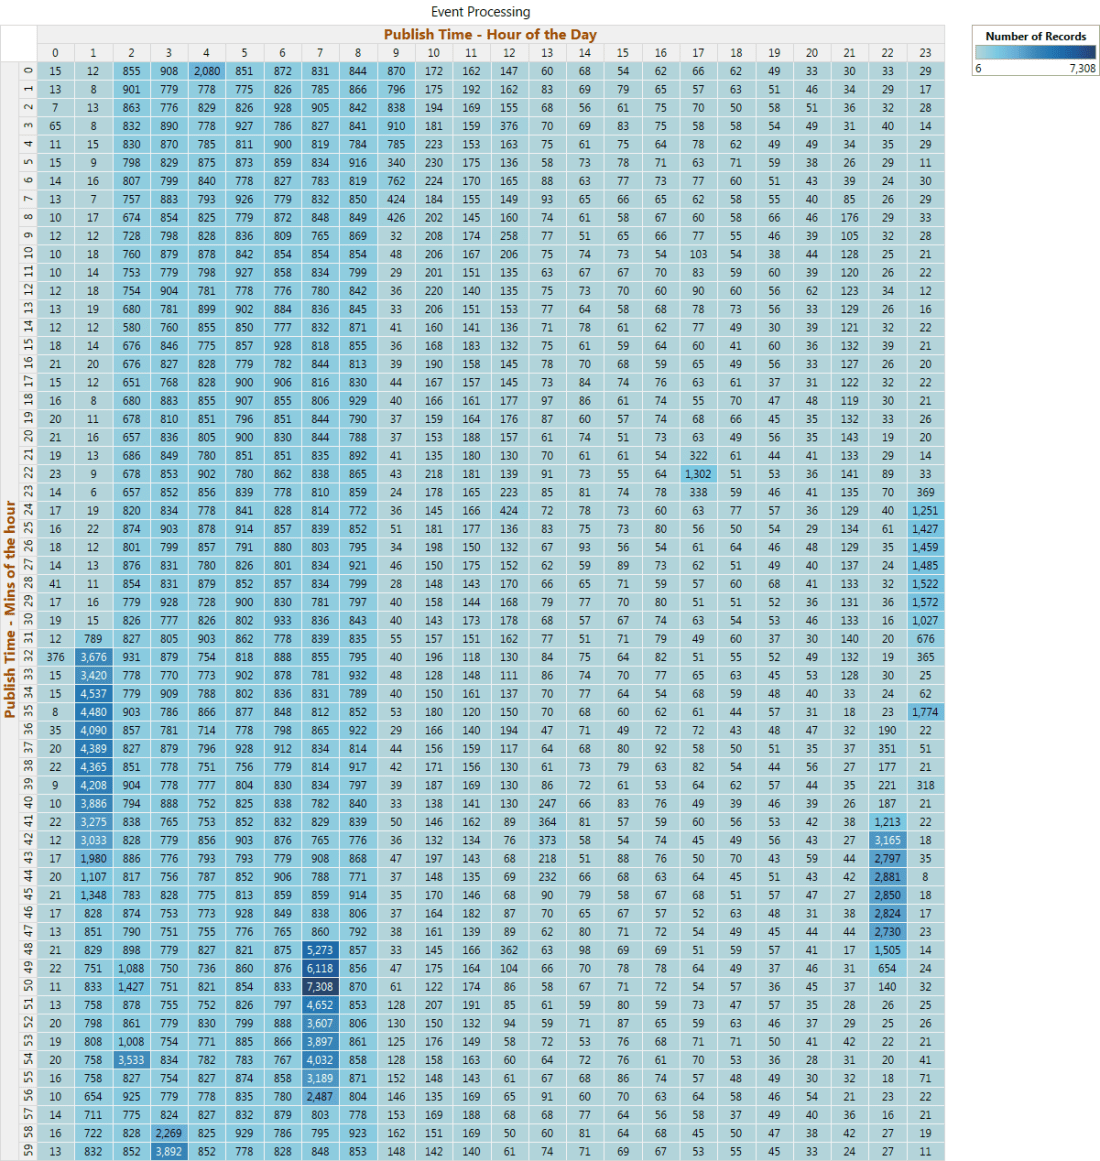
Figure 6 shows the heat map for the number of events processed each minute of the hour. This visualization helps in understanding the event processing pattern throughout the day.
In Summary, APM and log analysis tools are good at monitoring the system performance and the analysis of the well formatted logs fed to the log management tool. There are scenarios where it is easy and helpful to visualize the raw data from the logs in tools like Tableau to get better insight into the operational metrics and discover unknown patterns from the data.

very good one! would like to discuss further and share ideas. would like to get in touch with you
LikeLike
It is really a nice and useful piece of info. I am satisfied
that you simply shared this useful information with us.
Please stay us informed like this. Thank you for sharing.
LikeLike